Classification_Result
Classification with Fuzzy system Part2 (Result)
Basically, this post is about how to wrap up the results from training classification with Fuzzy system by Gaussian pdf with different standard deviation. I will illustrate how standard deviation in Multivariate Gaussian pdf generates different prediction(max position) and mean value across output nodes. The visualization of the summary result will be based on the fitted value(good and inferior product images) and prediction(unknown images) since I trained the model with respect to good and inferior images.

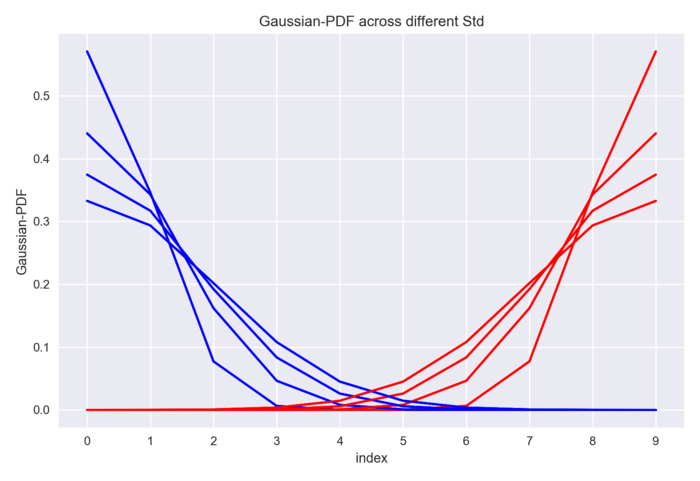
Different standard deviation(I assumed covariance matrix as std * Identity matrix) in Multivariate Gaussian across ratings can be displayed like the above. Since I will use half of Gaussian distribution with mutually exclusive classes and cross-entropy as a cost function, I set up the sum of pdf equals 1 and each probability value is between 0 and 1(for sure). Although softmax function will satisfy those two criteria, I pre-adjust the settings. On the purpose of grading , the average value across 10 output nodes is used here because it provides the degree of goodness and inferiority.

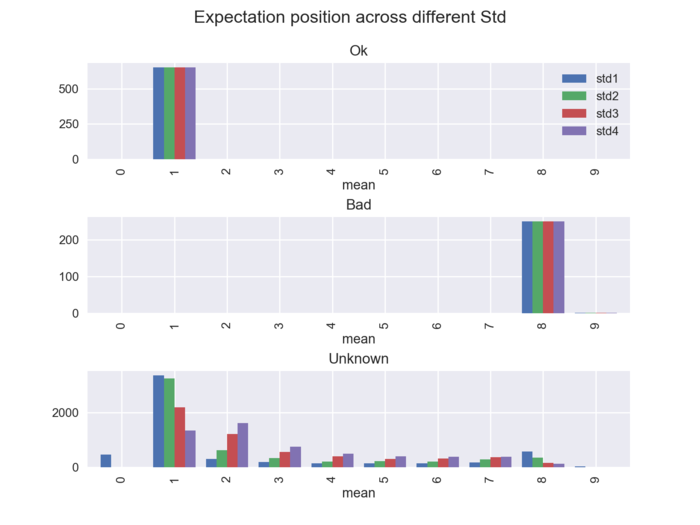
To validate the model, I made a bar plot for the max position(prediction) and mean position(expectation) of 10 output nodes grouped by different Std. With respect to fitted value(good and bad images), the result shows that the model is quite-well trained in terms of max and mean position. For prediction(Unknown images), the higher Std, the more images are distributed across ratings.
Moreover, to check how each image is predicted from different std model, I produced a CSV file containing each value (mean position or max position) across the different std and measure the std of the each value across different model. This procedure enables us to suggest suspicious images and request confirmation for the label of images to engineers.


