OLS vs. Update Learning in Regression
Regression in terms of Statistics vs. Computer Sciecne
| Statistics | Computer Science | |
|---|---|---|
| Method | Algebra | Update by Learning |
| Parameter(Regression) | OLS | Delta Rule |
- Regression by Algebra(Statistics)
Goal: Find parameters that minimize OLS(Ordinary Least Squares)

- Regression by Learning(Computer Science)
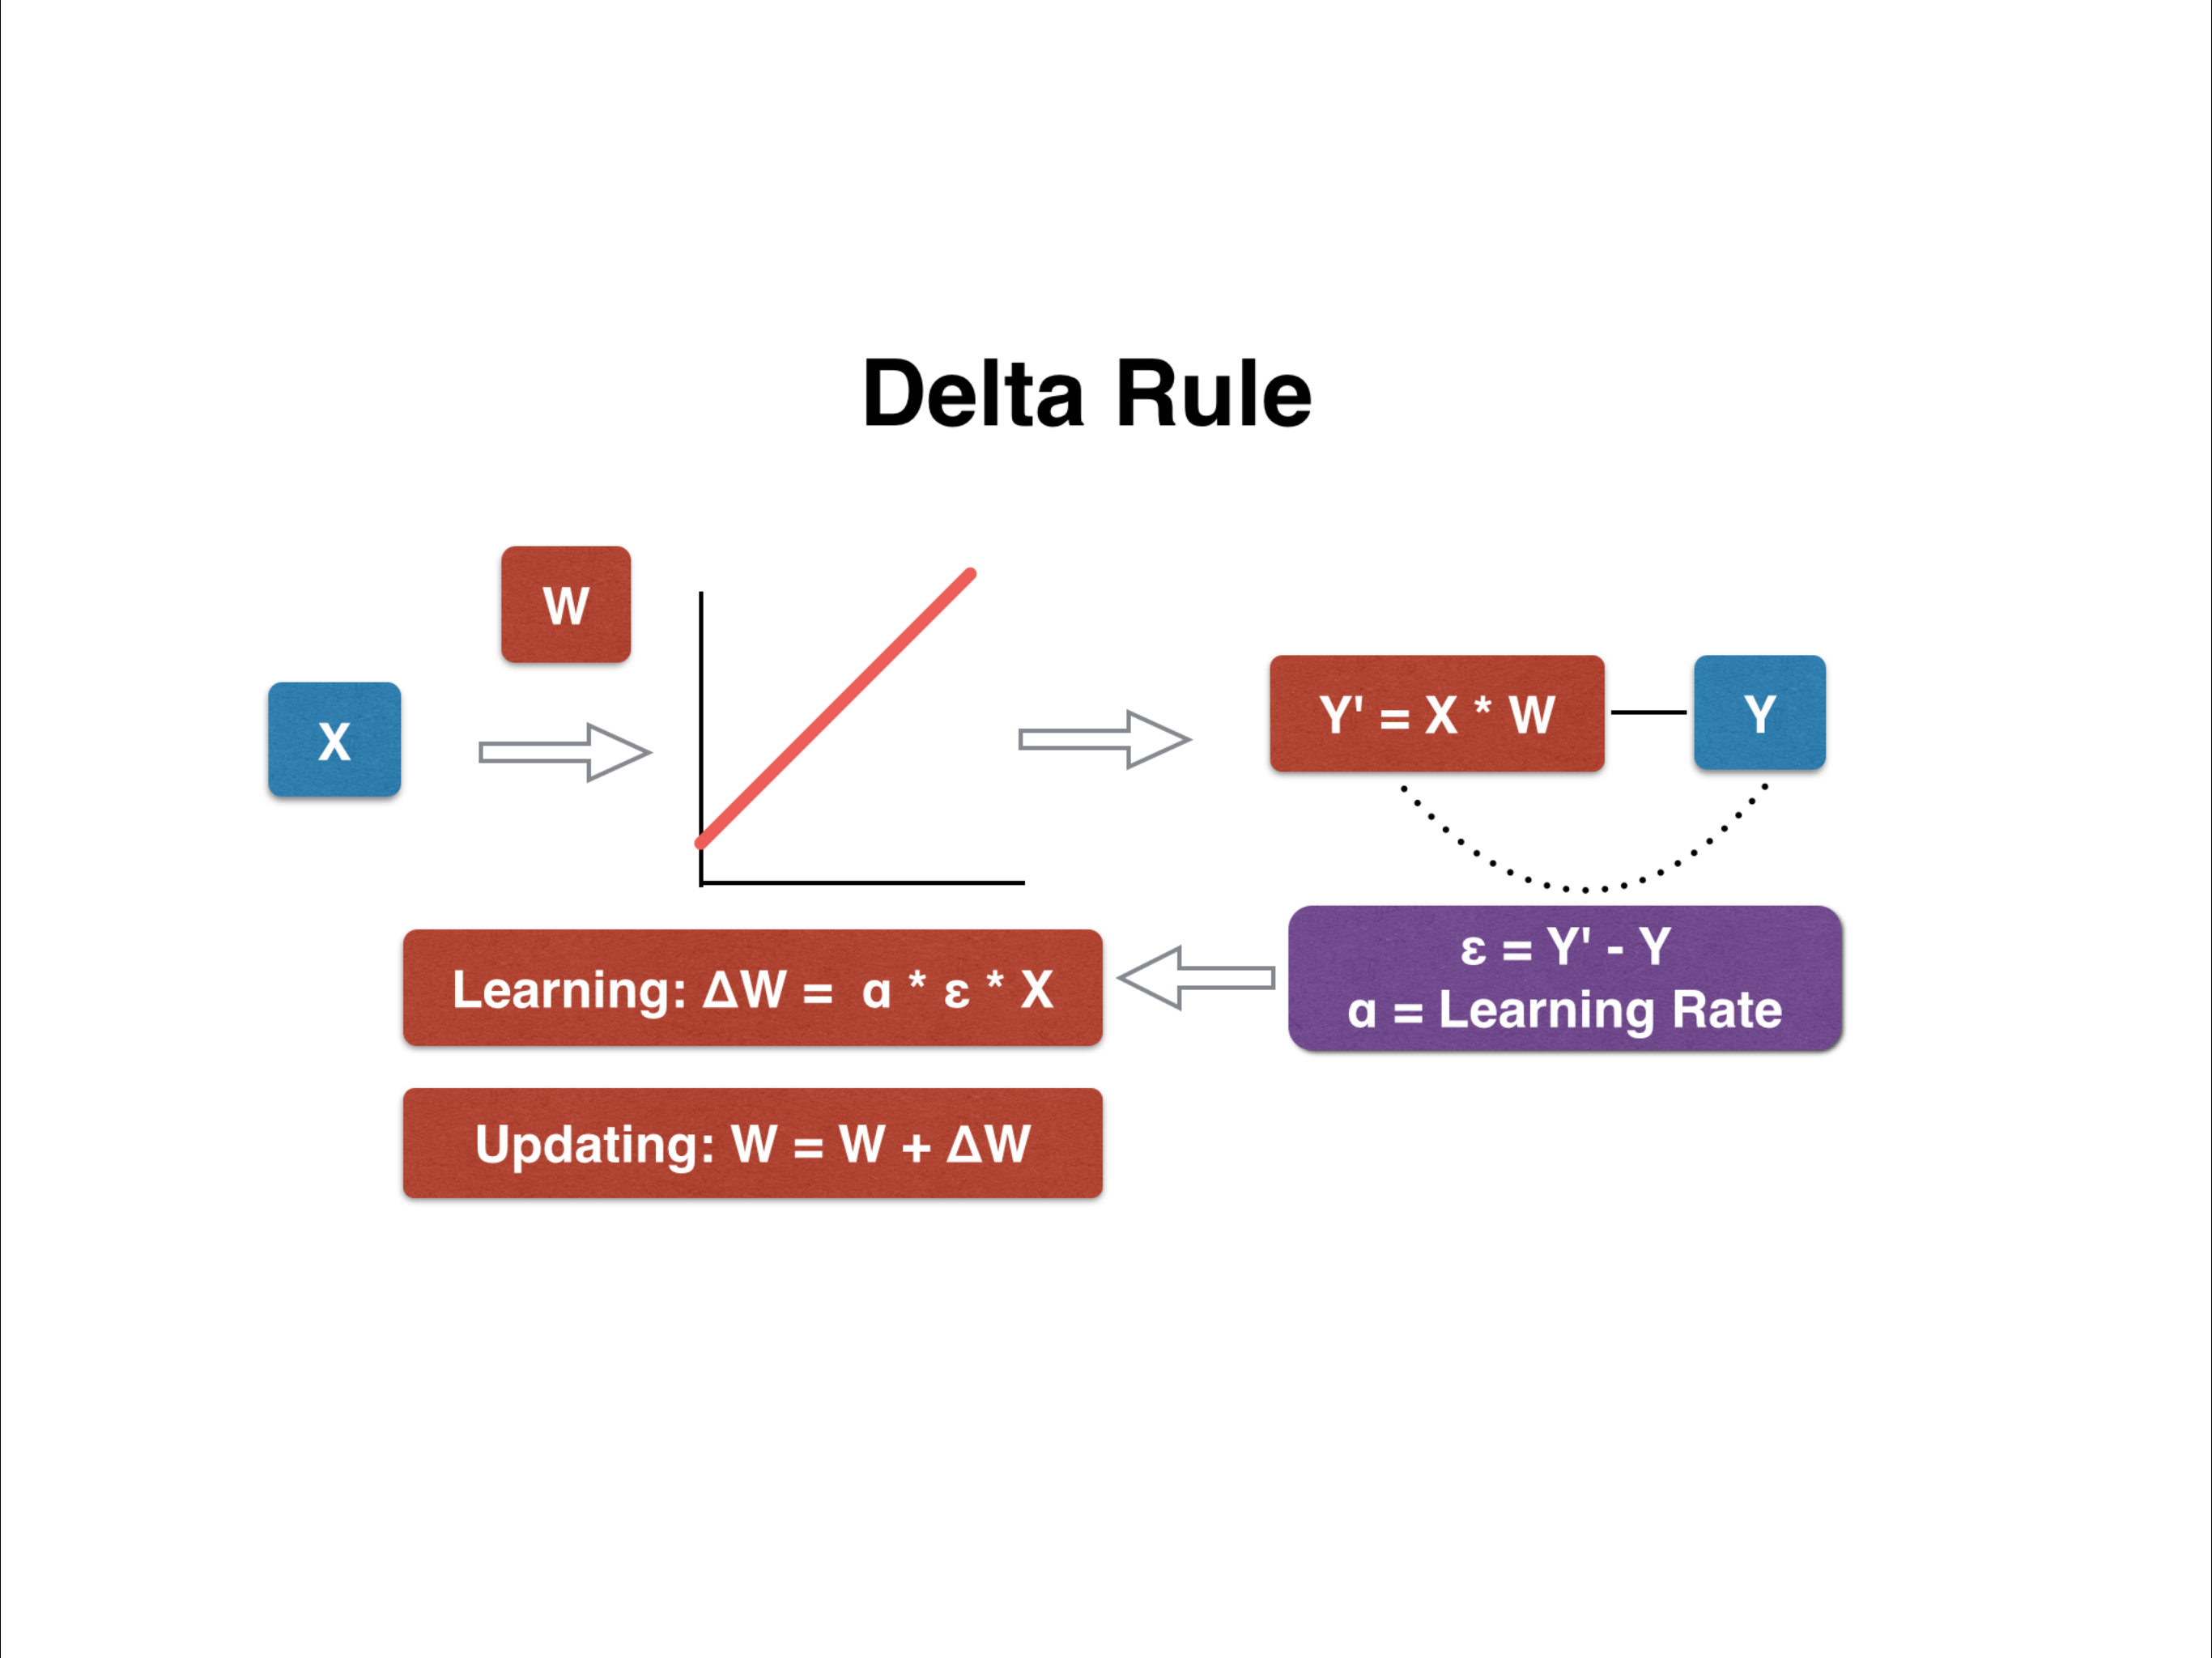
Goal: Update parameters that minimize error (Y - Y’) given the epochs

When a = 0.1 and x, y are given, below table shows the procedure of updating parameter
| data | learning | Update | |||
|---|---|---|---|---|---|
| x | y | w | y’ | e | delta_w=aex |
| 2 | 1 | 0.3 | 0.6 | 1 - 0.6 = 0.4 | 0.08 |
| 3 | 0 | 0.38 | 1.14 | 0- 1.14 = -1.14 | -0.342 |
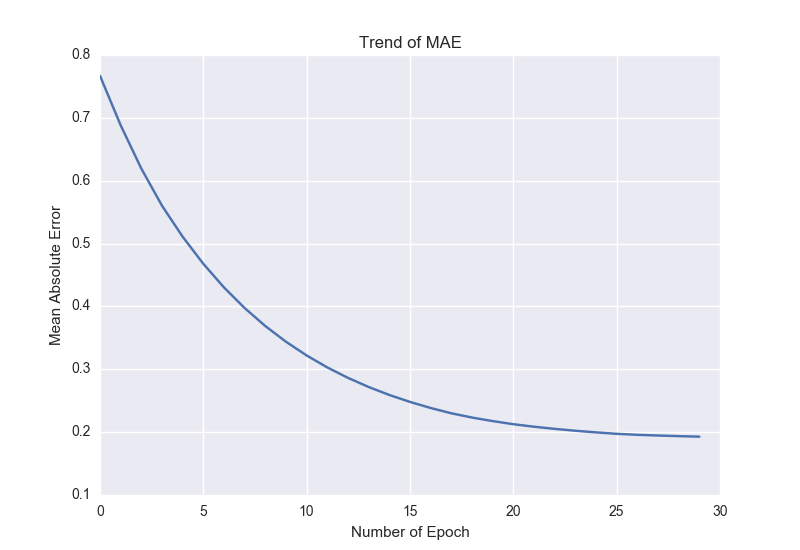
Multiple regression: MAE(Mean Absolute Error) and Paramters
- MAE changes as epoch increases

import numpy as np
import matplotlib.pyplot as plt

# **Multiple regression: y = w1 * x1 + w2 * x2 + b**

n = 30 # Number of data points
epoch = 30 # Numner of learning

np.random.seed(0)
x = np.random.rand(n,2)
d = np.random.uniform(0, 5, n)

w = np.random.rand(1,2)
b = np.random.uniform(0.001, 0.002, 1)

alpha = 0.1 # Learning rate

epdist = np.zeros((epoch,2))
wdata = np.zeros((epoch,2))
bdata = np.zeros((epoch,1))

for j in range(0,epoch):
        print(j)
        for i in range(0,n):
                y = x[i,:].dot(w.T) + b
                e = d[i] - y
                dw = alpha * e * x[i,:] # (1,2)
                db = alpha * e
                w += dw
                b += db
        wdata[j,:] = w
        bdata[j,:] = b
        d1 = x.dot(w.T) + b
        dist = d1 - y
        dist1 = np.mean(abs(dist)) # MAE
        epdist[j,0] = j ; epdist[j,1] = dist1 # Matrix for epoch # and MAE

# Visualize MAE changes as epoch increases
fig = plt.figure()
ax = fig.add_subplot(111)
ax.plot(epdist[:,0], epdist[:,1])
ax.set_xlabel('Number of Epoch')
ax.set_ylabel('Mean Absolute Error')
ax.set_title('Trend of MAE')

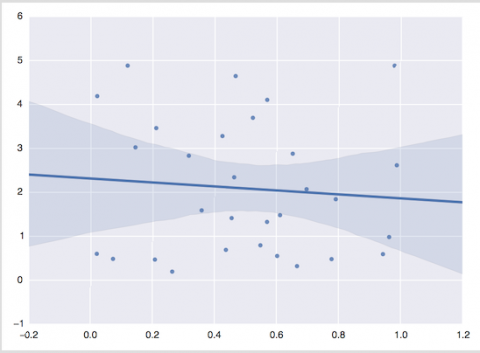
# Statistics: Regression visualization )
import seaborn as sb; sb.set(color_codes=True)
ax = sb.regplot(x=x[:,0], y=d)


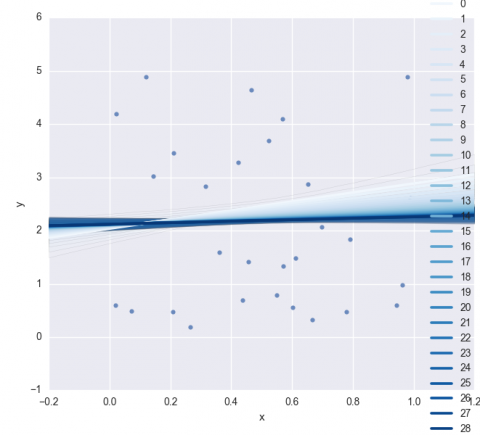
# Computer Science: Learning result visualizaion
y_pred = np.zeros((epoch, n))
for j in range(0, epoch):
    y_pred[j] = x.dot(wdata[j, :].T) + bdata[j]

import pandas as pd
num = np.repeat(np.arange(epoch), n)
x1 = np.tile(x[:,0],epoch)
y1 = np.concatenate(y_pred)
df = pd.DataFrame({'epoch':num ,'x':x1, 'y':y1})

sb.lmplot("x", "y", data=df, hue='epoch', fit_reg=True, palette="Blues",scatter=False, size=7, aspect=2)
sb.regplot(x=x[:,0], y=d, fit_reg=False)
sb.plt.show()
